In light of our new cluster procurement for NHR@FAU, we ran several benchmarks on both an Intel Xeon “Ice Lake” Platinum 8360Y node (2x 36 cores + SMT) and different NVIDIA GPUs to determine the optimal hardware configuration for our users. For the corresponding host CPUs of the GPUs, please visit our documentation pages on TinyGPU and the testcluster. The MD simulation code Gromacs runs without problems on CPUs and has been able to offload time-consuming calculations like PME to the GPU since version 2018. For the past few years, Gromacs developers have been adding offloading to the GPU for bonded interactions and for the calculation of updates and constraints. With these significant code changes, the question arises which hardware yields the best overall performance results.
The benchmarks are:
- R-143a in hexane (20,248 atoms) with very high output rate,
- a short RNA piece with explicit water (31,889 atoms),
- a protein inside a membrane surrounded by explicit water (80,289 atoms),
- a protein in explicit water (170,320 atoms),
- a protein membrane channel with explicit water (615,924 atoms), and
- a huge virus protein (1,066,628 atoms).
For running these benchmarks on a GPU, the following command will be executed “gmx mdrun -v -s $benchmark.tpr -nb gpu -pme gpu -bonded gpu -update gpu -ntmpi 1 -ntomp $ntomp -pin on -pinstride 1 -nsteps 200000 -deffnm $benchmark_name” in order to offload all possible calculations to the GPU and pin the threads to the host CPU; the number of OpenMP threads has to be chosen regarding the host CPU (e.g. 8 for our V100, RTX3080, and A40, 16 on the A100)¹.
On the CPU node, the command has a few more variables, because for each system, the optimal number of threads dedicated to PME, thread-MPI and OpenMP has to be determined beforehand: “gmx mdrun -v -s $benchmark.tpr -npme $npme -ntmpi $ntmpi -ntomp $ntomp -nsteps 30000 -resethway -maxh 0.1 -dlb yes -pin on -pinstride 1 -deffnm $benchmark_name”. In accordance with our previous post on Multi-GPU Gromacs Jobs, we used Gromacs version 2021 as available on our clusters.
| [ns/day] | system 1 | system 2 | system 3 | system 4 | system 5 | system 6 |
| Intel ‘Ice Lake’ node | 73.9 | 210.9 | 87.5 | 38.3 | 10.8 | 6.3 |
| NVIDIA V100 | 163.8 | 408.7 | 153.1 | 73.3 | 23.4 | 13.2 |
| NVIDIA RTX3080 | 195.9 | 580.4 | 191.2 | 91.3 | 26.4 | 14.6 |
| NVIDIA A40 | 143.6 | 565.0 | 194.8 | 102.7 | 29.6 | 16.1 |
| NVIDIA A100 | 197.5 | 673.1 | 247.1 | 116.0 | 36.9 | 22.3 |
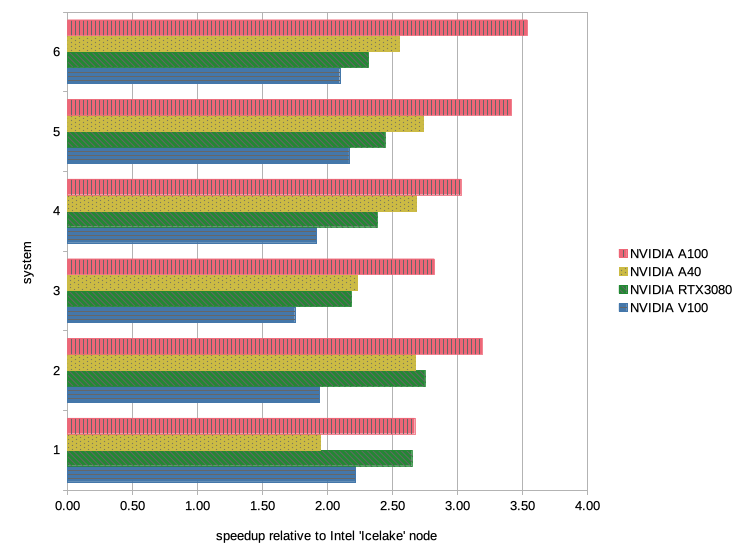
Regardless of the age or architecture of the GPU, the benefits are quite obvious: the performance can be increased for all systems tested when adding an accelerator that takes care of the most time-consuming calculations. A three-year-old NVIDIA Tesla V100 beats the CPU performance by far and in case of the two largest benchmarks, it can even compete with recent models like RTX3080 or A40.
In the image below, we have visualized the data from the table to emphasize the effect a GPU can have on performance. The benchmark systems are represented on the Y-axis and the speedup in performance is given on the X-axis; the data for the benchmarks runs on the NVIDIA GPUs are listed as follows from top to bottom: A100 in red, A40 in yellow, RTX3080 in green, and V100 in blue.
The results on the Intel “Ice Lake” node are not bad per se, a lot has changed since the first endeavors of MD simulations, be it in code or hardware development. But still, a modern biomolecular forcefield has many terms that have to be processed every single time step of the simulation and that is plenty of work for the CPU. Thus, it is no surprise that the Gromacs developers put in a huge effort to port the code to GPU and by doing so, have opened a larger timescale to researchers interested in biomolecular dynamics.
Now, one might complain that this comparison is totally unfair, because who would use a single CPU node for an MD simulation, when Gromacs scales wonderfully on CPUs and the whole MD simulation of the investigated system finishes quicker on a large CPU cluster. Thus, we ran a scaling benchmark test of system 3 (80,289 atoms) on our Meggie cluster, using the same command for CPU as above with an additional “mpirun -n $number-of-processes -ppn $number-of-processes-per-node” beforehand. Apart from invoking the program correctly, it is mandatory to run in-depth scaling tests in order to find optimized parameters for running Gromacs on a CPU cluster.
| [ns/day] | 1 node | 2 nodes | 4 nodes | 8 nodes | 12 nodes | 16 nodes |
| system 3 | 17.9 | 35.0 | 65.4 | 120.4 | 165.4 | 207.9 |
And, yes indeed, scaling works quite well with Gromacs on CPU. However, it is not perfect, as we lose about 10% of the performance each time we double the number of nodes starting from 2 nodes. In the following, we have plotted these data in addition to scaling results without the expected performance loss due to inter-node communication. The number of nodes are on the X-axis and the performance in nanoseconds per day is on the Y-axis.
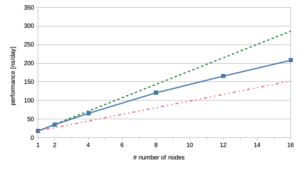
The green dashed line in the graph on the right shows the results in a ‘perfect world’, the red dash-dotted line gives the data for 50% efficiency and the solid line represents our actual results. Taking into consideration how unhappy we were with our scaling runs on multiple GPUs, the results shown here are basically fine, as they reflect the scaling behavior of Gromacs on multiple CPUs.
But taking a closer look at those numbers and comparing them to the GPU results for system 3 given in the first table, it becomes apparent that we need at least 12 Meggie nodes to match the performance of one NVIDIA V100. Even more, we have to use approximately 16 Meggie nodes to yield a higher performance than the benchmark runs on the NVIDIA RTX3080 or A40. Although it is possible to reproduce the results from the NVIDIA A100 run on CPUs, the amount of performance loss due to inter-node communication is simply not worth it.
Additionally, the hardware costs² for those 12 Meggie nodes are about double the amount of a V100 GPU and its fraction of the host CPU. Trying to gain the same performance on the Intel ‘Ice Lake’ CPU node, we would need at least two of those new Xeon CPU nodes and by doing so, the price for the hardware would be roughly a multiple of 1.2 compared to the V100 setup. Furthermore, if we try to obtain the NVIDIA A100 performance on the Intel ‘Ice Lake’ hardware, we would have to spend nearly 1.5 times the amount of money on the three CPU nodes than on the A100 and its fraction of the host CPU.
Note that these numbers always have to be taken with a grain of salt, because hardware prices are moving targets. Moreover, the Broadwell CPUs in Meggie are from early 2016, whereas the V100 is from mid-2017; also, the Broadwell chips have 10 cores only, so one could argue that this is not really comparing apples with apples. However, the general method is still sound because it’s not only the time to solution that counts but also the amount (i.e., the monetary equivalent) of resources used. For a complete picture one may also add the energy consumption to the overall cost.
For a more recent hardware match to the A100 regarding pure CPU setups, we have also benchmarked system 3 on the HLRS flagship supercomputer HAWK located in Stuttgart. The compute nodes in this cluster consist of two AMD EPYC 7742 CPUs each and it has a total peak performance of 22 Petaflops. As expected, scaling across several nodes works well and the abundance of available cores directly influences the performance.
| [ns/day] | 1 node | 2 nodes | 3 nodes | 4 nodes | 5 nodes | 6 nodes |
| system 3 | 115.2 | 208.0 | 295.5 | 369.7 | 425.3 | 477.8 |
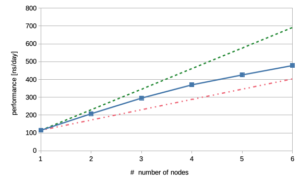
Again, we have plotted these data using a solid blue line and have added the results from a perfect world without performance loss across several nodes as a dashed line in green; the data for 50% efficiency are shown by the red dash-dotted line. The number of nodes are on the X-axis and the performance in nanoseconds per day is represented on the Y-axis. Nevertheless, before getting too excited about these promising results, let us return to the data we got from system 3 on GPUs. Strikingly, it still takes three HAWK nodes to beat the performance on the A100; it terms of money, the CPU nodes are nearly five-fold the amount of an A100 GPU including its fraction of the host CPU.
In summary, the data given in this article show that the overall performance of running the Gromacs code on GPUs is significantly higher than on CPUs even if scaling is much better on multiple CPUs. Please keep in mind that for most efficient use of the CPU hardware it is pivotal to run extensive scaling tests in order to find optimized parameters. However, procuring and maintaining a large CPU cluster is much more expensive than handling a GPU cluster that can offer the same throughput.
NHR@FAU recommendation: In order to use the existing and future hardware as efficiently as possible, please consider our TinyGPU cluster in case you want to run biomolecular MD simulations with Gromacs. If you need help in setting up the simulations on GPU or are unsure which program flags to use, please do not hesitate to let us know.
Contact us
- Email: hpc-support@fau.de
Footnotes
1 We have documented for TinyGPU that several GPUs are combined with one host CPU, i.e. each GPU has access only to a fraction of the whole CPU. The number of OpenMP threads for the set of benchmarks in this article is optimized for the fraction of CPU available to the GPU and thus, should not be taken as a rule to be applied generally.
2 Prices were taken from alternate.de, if available; otherwise from deltacomputer.com or sysgen.de. The price for the NVIDIA V100 was copied from internal notes, in which information on prices was gathered from deltacomputer.com. If VAT information was excluded on the vendor website, it has been added by hand before the overall calculation. The costs for the host CPUs of GPU setups are fractions of the whole CPU price depending on the amount of GPUs per CPU as noted in our documentation. For the A40, it was assumed that one host CPU is connected to four GPUs.