Success story: Elmer/Ice
Optimization of a Glacier Ice Simulation Code
Background
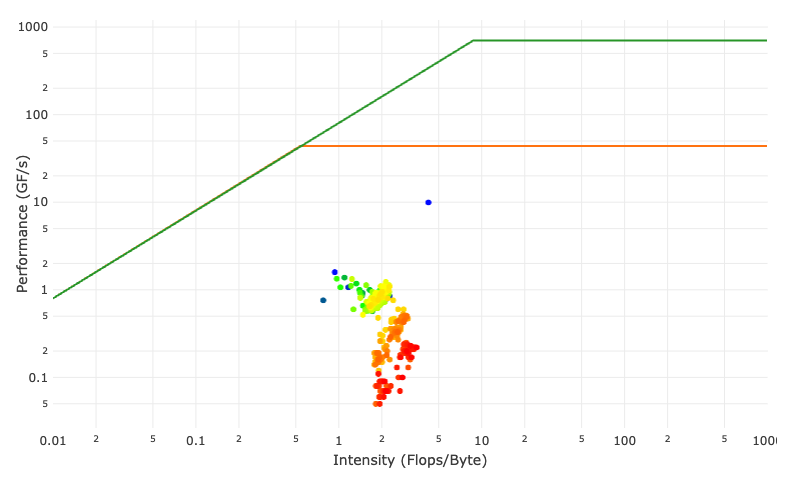
Several jobs showed a very low performance in our job performance monitoring system. The job performance roofline plot shows that the code does not address any resource limit by orders of magnitude.

The HPC support contacted the customer and offered support to increase resource utilization. The customer does glacier research using the MPI parallel Elmer/Ice application package. Elmer/Ice is based on the general purpose finite element solver Elmer and is implemented in Fortran90. The customer was consuming a significant amount of core hours on our systems with jobs usually using one to a moderate number of nodes and running from 10 minutes to 15 hours. Elmer is specialized on complex multi physics simulations. It uses a special text file format (SIF) to specify the overall simulation setup. Users can add own functionality by implementing Fortran libraries which are later referenced in the SIF file. This analysis was using Elmer/Ice v8.4. The customer prepared several test cases that reassembled real production behavior.
Overview
Application Info
- Name: Elmer/Ice
- Domain: Open Source Finite Element Software for Ice Sheet, Glaciers and Ice Flow Modelling
- URL: http://elmerice.elmerfem.org
- Github: https://github.com/ElmerCSC/elmerfem
- Version: v8.4 commit 9f6699bb55c2956a477dc6f318d2c21c5d86a6fb
Testsystem
- Host/Clustername: Emmy
- Cluster Info URL: https://hpc.fau.de/systems-services/documentation-instructions/clusters/emmy-cluster/
- CPU type: Intel Xeon 2660v2 „Ivy Bridge“
- Memory capacity: 64GB
- Number of cores per node: 20
- Interconnect: Fat Tree QDR Infiniband
Software Environment
Compiler:
- Vendor: Intel
- Version: ifort (IFORT) 19.0.2.187 20190117
OS:
- Distribution: CentOS Linux
- Version: 7.6.1810
- Kernel version: Linux 3.10.0-957
Difficulties
As many other community codes Elmer/Ice has a lot of external dependencies. It already takes a significant time to prepare and build all external packages using an optimized tool chain (Intel IFORT 19.0.2 in out case). We already failed at the next step: To acquire a meaningful runtime profile. The standard tools (gprof and perf) did not manage to produce a usable runtime profile. No application symbols were visible and the top consumer was a system call. It seems the sophisticated dynamic library loading mechanism used prevents that standard runtime profiling catches the relevant code segments. Fortunately out contact at Intel knew another Intel employer that is specialized in Elmer. This contact gave us the hint to enable the internal time measurement for profiling. Finally we got something we can start with.
Analysis
We first focused on a sequential analysis. The internal solver timings revealed large difference in runtime among different solvers. Two solvers took a factor 10 longer than the other solvers per call. A static code review showed that the source code of most solvers is almost identical apart from one call to an entity that was declared in the SIF file as a so called MATC expression. MATC is a subsystem in Elmer that allows to evaluate mathematical expression in the SIF file. Replacing the MATC expression reference in the Fortran source by a constant showed that the runtime difference between solvers is indeed caused by the MATC expression.
In addition we performed a hardware performance counter analysis using likwid-perfctr in stethoscope mode:
likwid-perfctr -c S0:0,1 -g MEM_DP -S 20s
The results show that the code still does not address any resource limit. Flop rate as well as memory bandwidth are on a very low level (150-170 MFlops/s and 130 MB/s ). Arithmetic flops are mostly scalar (less than 6% for SSE and AVX). The fraction of arithmetic FP to total instructions was only 3.6%. L2 data volume was 111GB, L3 22GB and Main Memory 4.3GB. This indicates that the working set fits mostly in cache.
Here are the detailed results for the instruction decomposition:
| Type   |    count    | percent |
|--------|-------------|---------|
| Total	 | 75679744364 |  -      |
| Flops	 |  2710430546 |  3,58   |
| Branch | 13072069163 | 17,27   |
| Data	 | 35390832012 | 46,76   |
| Other	 | 24506412643 | 32,38   |
Optimization
The first finding was discussed together with the customer. It was possible to replace the MATC expression by a call to a Fortran subroutine. During discussion while reviewing the code a significant potential for saving application work was found. Several solvers do not need to be executed at every step but only at the end of the simulation leading to a significant time saving.
Summary and Outlook
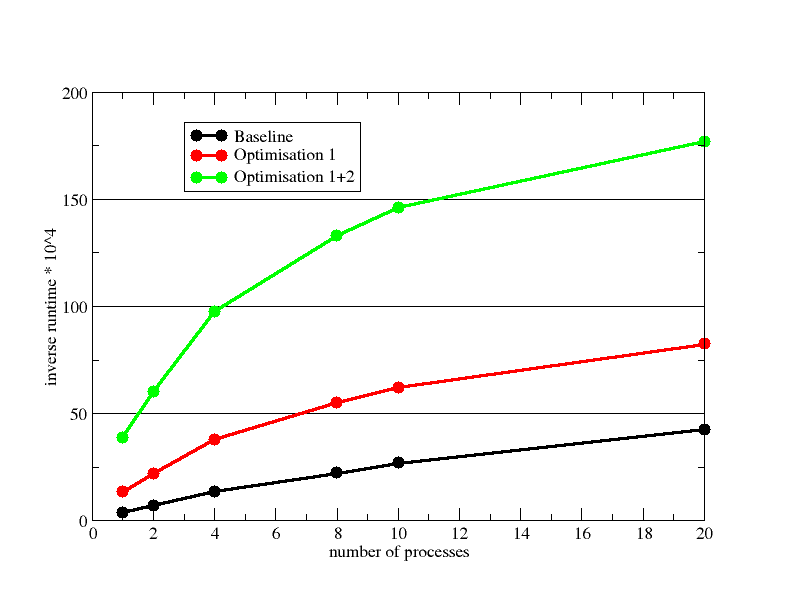
Eliminating MATC expressions (Optimization 1) and saving application work (Optimization 2) has led to a speedup of almost factor 10 (1 process) for our test case problem. A in-node scaling comparison is shown here:

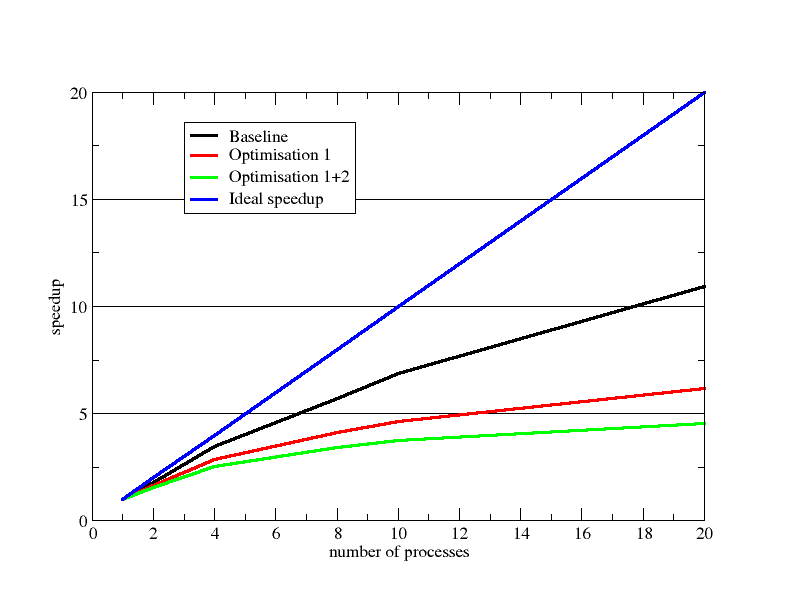
As already visible in the inverse runtime plot the speedup of the optimized variants is worse than the baseline:

The customer runs mostly throughput simulations with many instances of the same setup. For throughput the preferred operation point is with four processes where the parallel efficiency is still good and running 4 of those per node. Because the code does not consume any significant memory bandwidth no saturation is expected.
The performance could be significantly increased by getting rid of the MATC expressions and saving algorithmic work. The given test problem runs in cache. The overall fraction of arithmetic floating point instruction is very small and SIMD is not used and probably also would bring no benefit since runtime is governed mostly by load/store and other instructions. We invested around 30 hours in this case. While we could achieve a large speedup the code still does not address any resource limitation.
It is is beyond our scope to investigate changes in Elmer core code we already plan to do more research regarding external solvers used by Elmer. Also the Elmer community itself is aware of performance problems and hopefully can improve performance in the future.
