AMBER performance on NHR@FAU GPU systems
Since 2022, NHR@FAU has its GPU cluster “Alex” in operation, which contains a total of 192 NVIDIA A100 and 304 NVIDIA A40 GPGPUs with eight cards per node. To allow for an easier comparison with the already installed GPUs in the “TinyGPU” cluster (NVIDIA RTX2080Ti, NVIDIA RTX3080, and NVIDIA V100) and to provide potential users with a rough estimate of the computational requirements of their systems, we decided to run the standardized AMBER benchmark, which is publicly available from the AMBER website. Thus, we investigated the performance of the CUDA-implementation of the Amber module pmemd.
Since the progress in program development and optimization might also be of interest to potential users, we included the versions 22 and 24 of AMBER into this study. More specifically, we loaded one of the following modules in our Slurm file:
# AMBER22 (patch level 05) with AmberTools23 (patch level 06) and CUDA11.8
module load amber/22p05-at23p06-gnu-cuda11.8
# AMBER24 (patch level 02) with AmberTools24 (patch level 05) and CUDA12.4
module load amber/24p02-at24p05-gnu-cuda12.4
Overview
The benchmark set comprises four biomolecular systems of different size for explicit solvent simulations: Dihydrofolate Reductase (JAC; 23,558 atoms); Factor IX (90,906 atoms); Cellulose (408,609 atoms); Satellite Tobacco Mosaic Virus (STMV; 1,067,095 atoms). We intentionally omit the General-Born systems here, because, according to our experience, this simulation method plays only a minor role in AMBER production MD simulations. In the same vein, we restrict ourselves to the NPT ensembles and note that other ensembles are computationally slightly less demanding.
For a more realistic comparison, we report the timing results for the simultaneous run of the benchmark calculation on all available GPUs on a single node; this is to mimick a typical job situation on a fully utilized cluster. As stated above, “Alex” has eight A40 or A100 GPUs per node; however, on “TinyGPU”, only the nodes with RTX3080 have eight cards, the others are equipped with four RTX2080Ti or V100 cards, respectively. Since the AMBER implementation runs completely on the GPU and does not consume substantial CPU resources, no further settings (e.g. with different CPU shares like in GROMACS) were tested.
Results
In the following, we provide the mean value and standard deviation of the AMBER benchmark runs (NPT, optimized settings). These were performed at two time points (15th and 28th Apr 2025) to account for potential load differences within the cluster network. The reported measure for the performance is the simulated nanoseconds per day (ns/day; larger is better), extrapolated from the actual run time from within the benchmark suite.
| JAC [ns/day] | RTX2080Ti | RTX3080 | V100 | A40 | A100 |
| AMBER22 | 946.3 ± 11.7 | 1030.9 ± 12.1 | 938.3 ± 3.2 | 1017.2 ± 26.0 | 1163.3 ± 46.3 |
| AMBER24 | 947.8 ± 11.4 | 1047.5 ± 15.1 | 794.1 ± 151.1 | 1029.1 ± 35.5 | 1131.9 ± 59.0 |
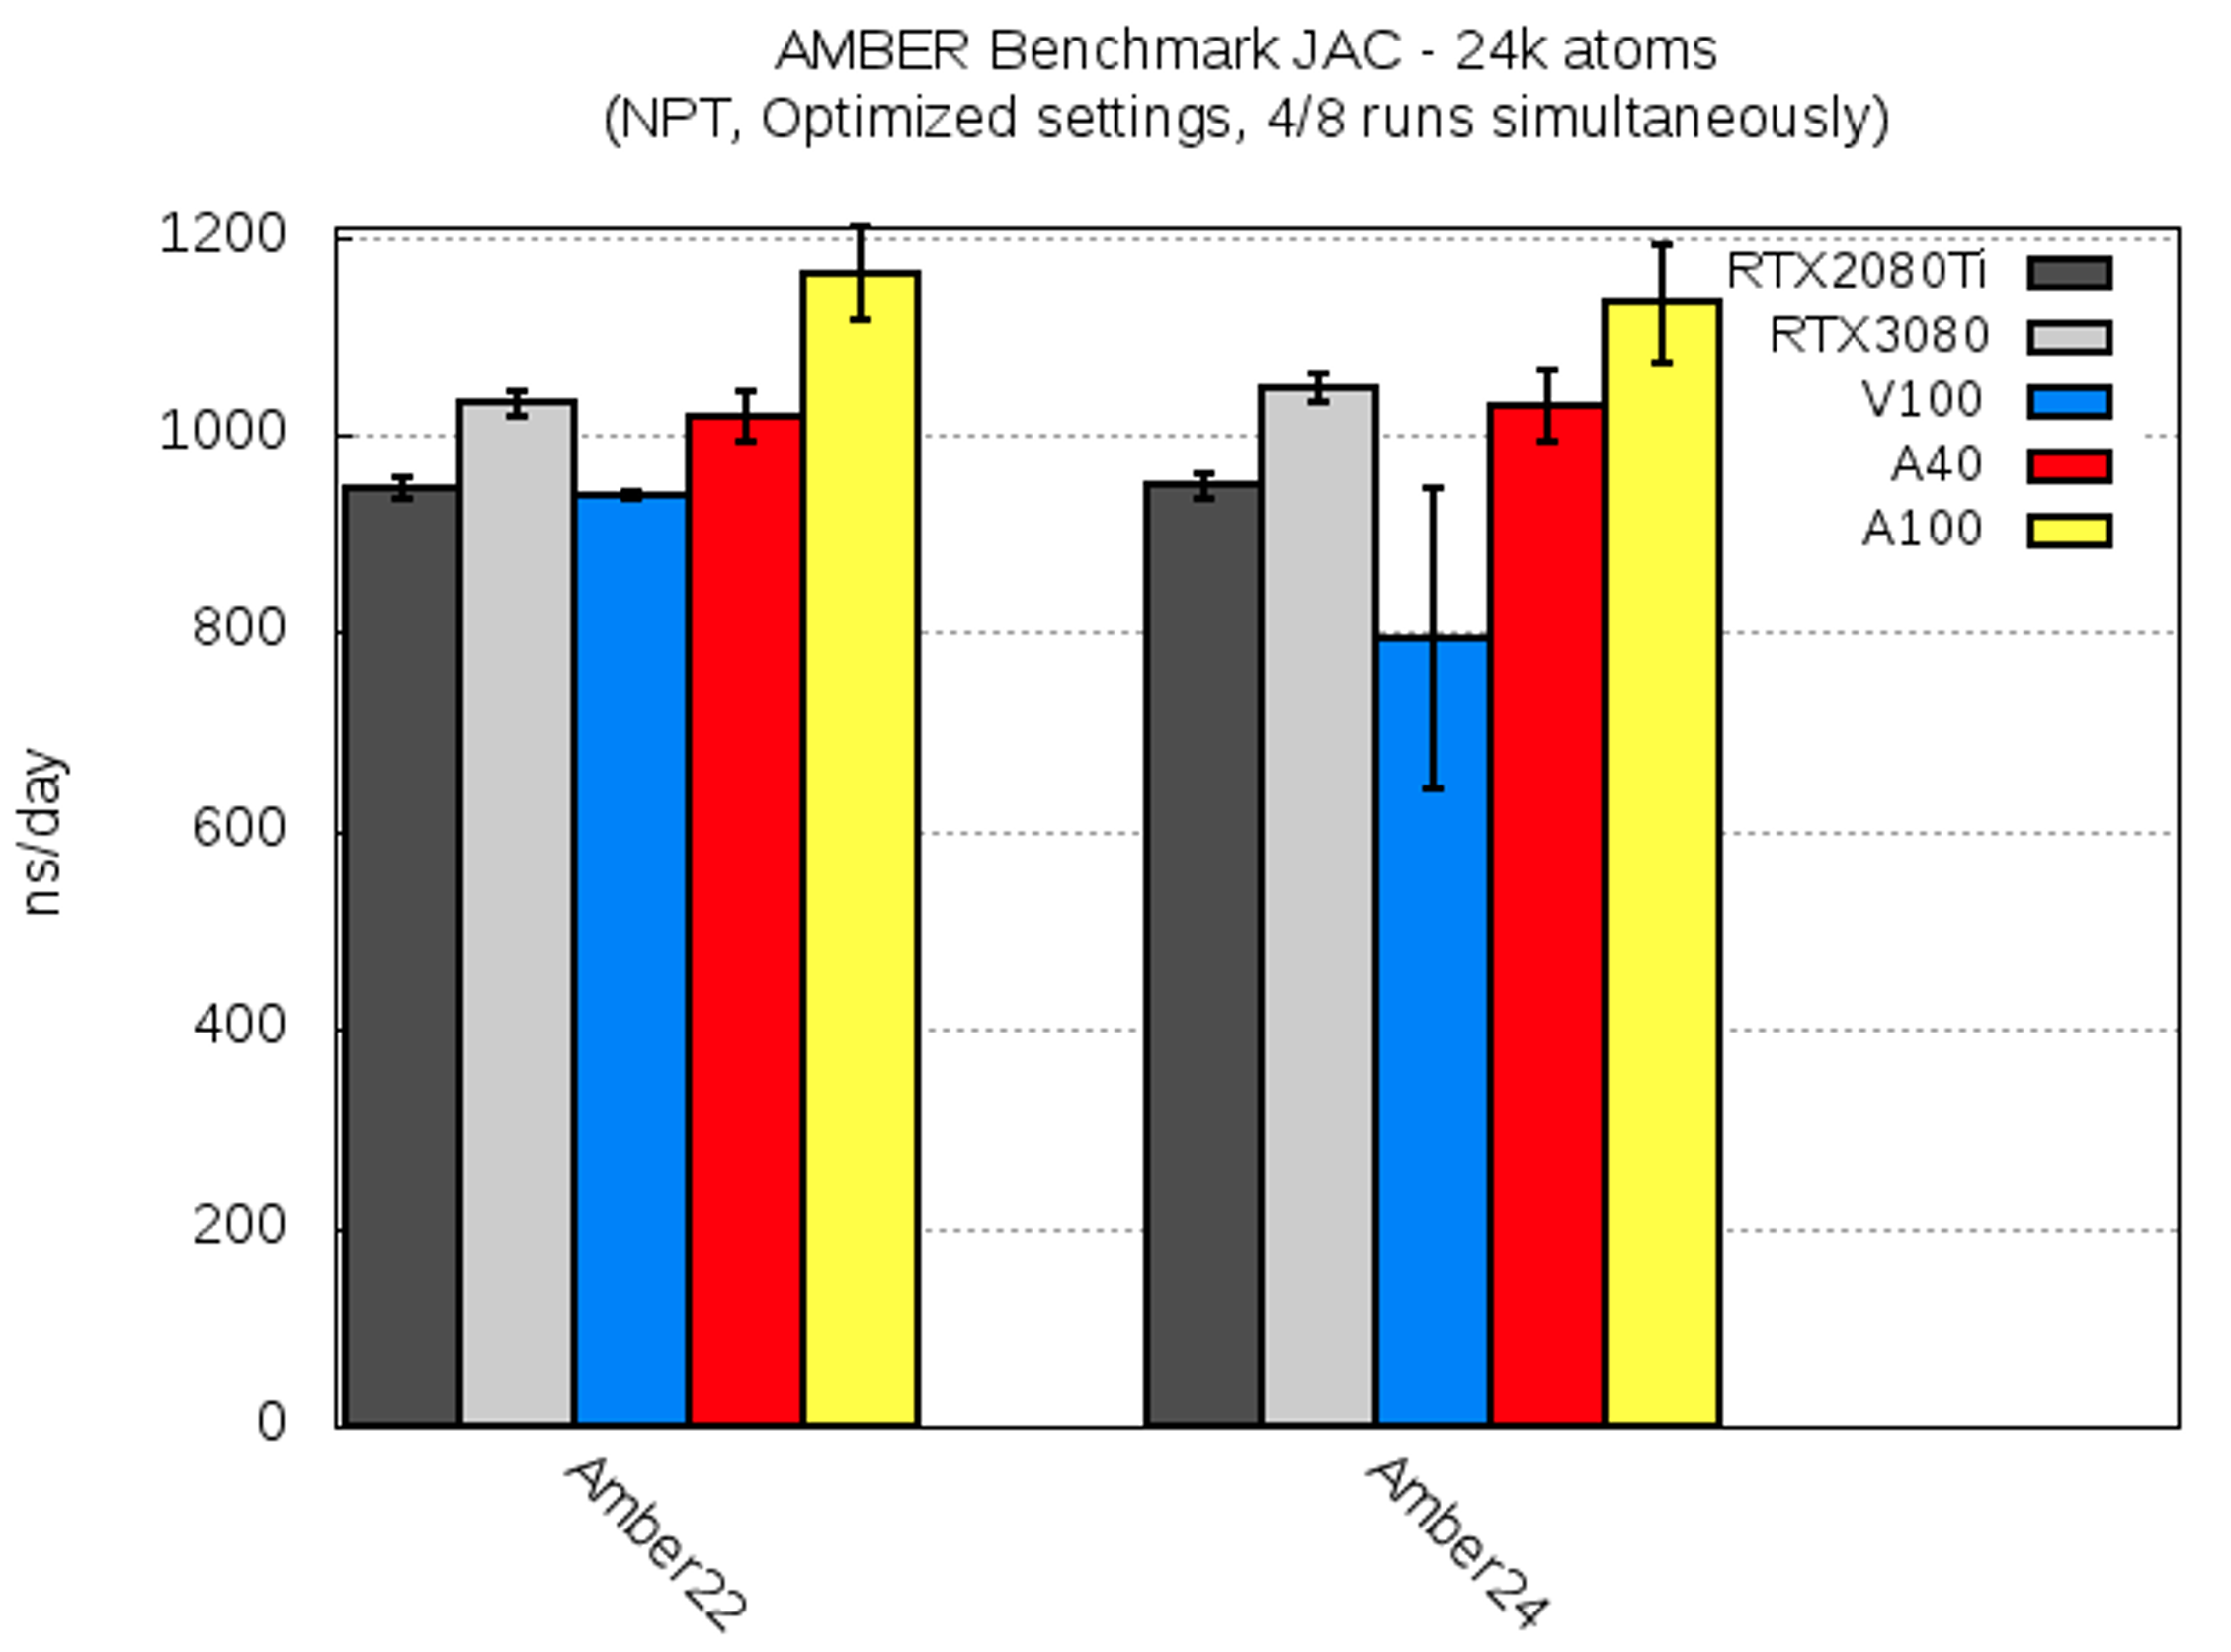
Overall, both AMBER versions yielded a similar performance for this smallest benchmark system. AMBER24 seemed to perform slightly worse on V100; however, this can be attributed to different cluster and network loads during the two runs: The results for V100 varied from ca. 600 to 950 ns/day between two run time dates. Large fluctuations in the run time might be due to small size of the benchmark system.
| Factor IX [ns/day] | RTX2080Ti | RTX3080 | V100 | A40 | A100 |
| AMBER22 | 333.2 ± 3.2 | 361.8 ± 28.9 | 365.7 ± 1.1 | 422.0 ± 9.5 | 504.8 ± 15.5 |
| AMBER24 | 337.7 ± 4.2 | 399.1 ± 5.9 | 373.7 ± 2.5 | 433.3 ± 9.0 | 511.7 ± 18.5 |
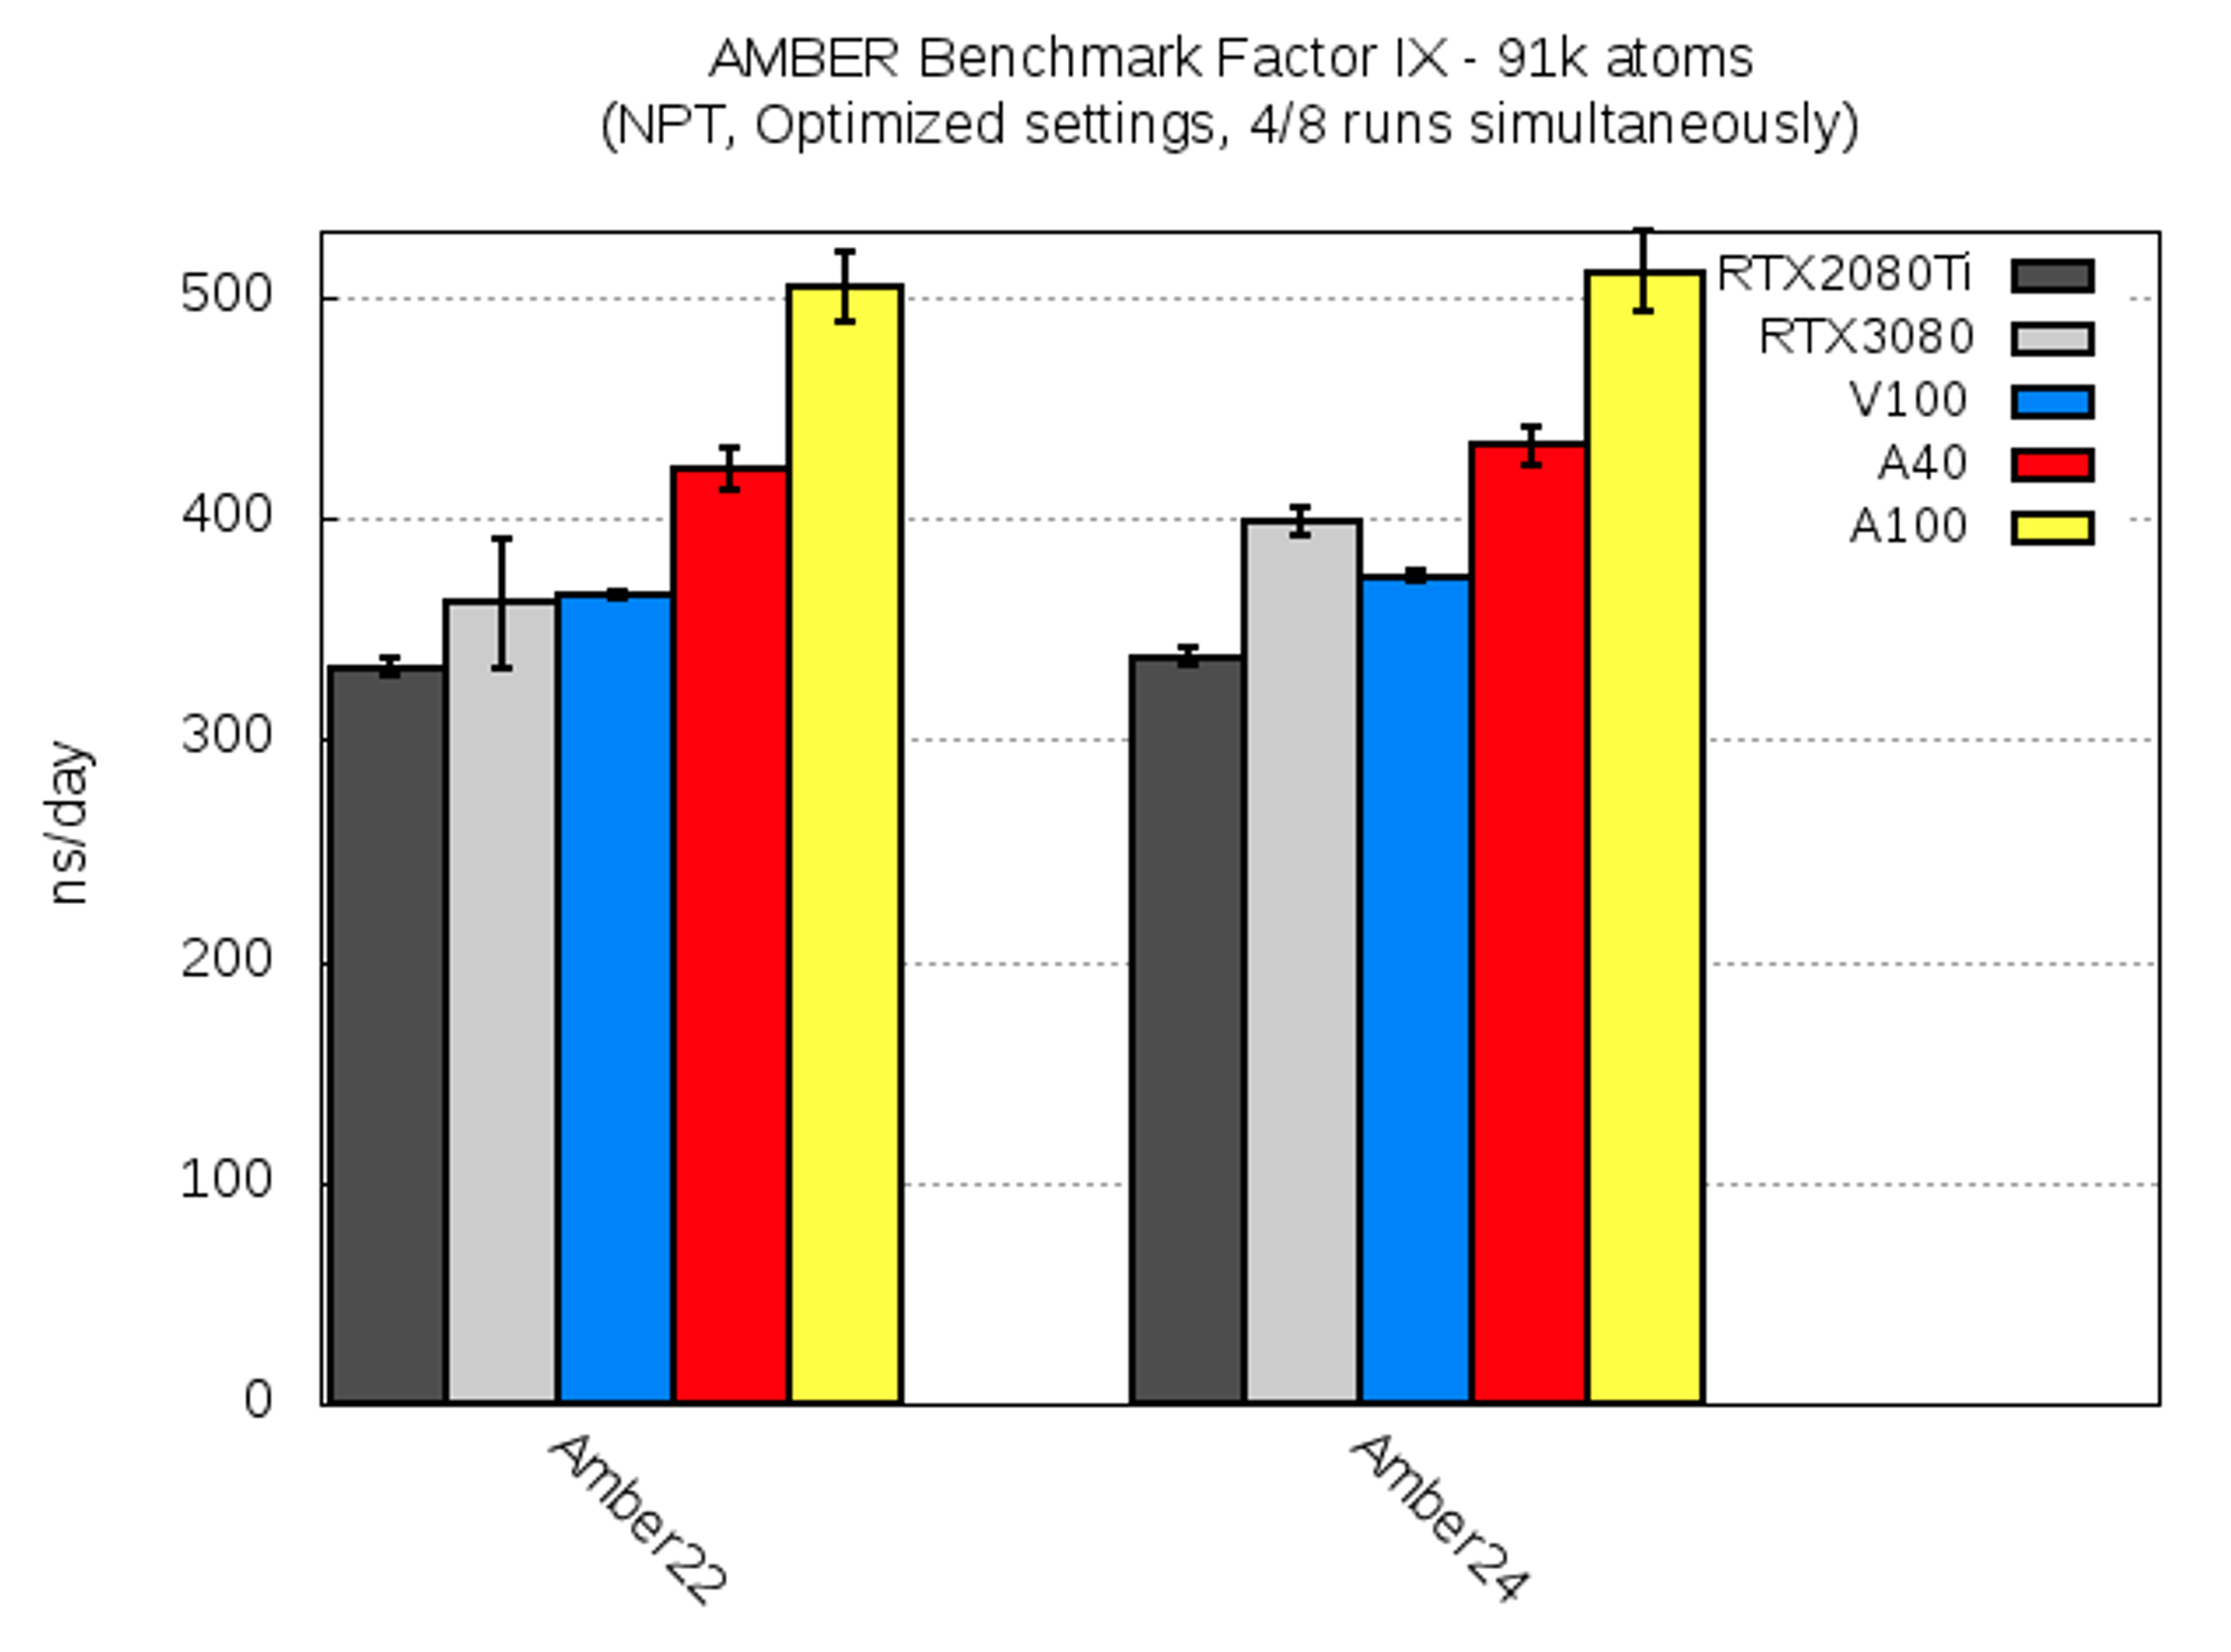 For this molecular system, AMBER22 and AMBER24 performed very similar, with the latter being slightly faster. Note that the RTX3080 AMBER22 run experienced heavy cluster network usage. This can be also seen from the standard deviation, and run times varied from ca. 330 ns/day to 390 ns/day.
| Cellulose [ns/day] | RTX2080Ti | RTX3080 | V100 | A40 | A100 |
| AMBER22 | 71.3 ± 0.7 | 82.2 ± 4.1 | 85.7 ± 0.4 | 95.1 ± 0.7 | 145.7 ± 1.2 |
| AMBER24 | 71.2 ± 0.8 | 88.6 ± 1.1 | 87.8 ± 0.5 | 99.3 ± 0.7 | 152.1 ± 1.9 |
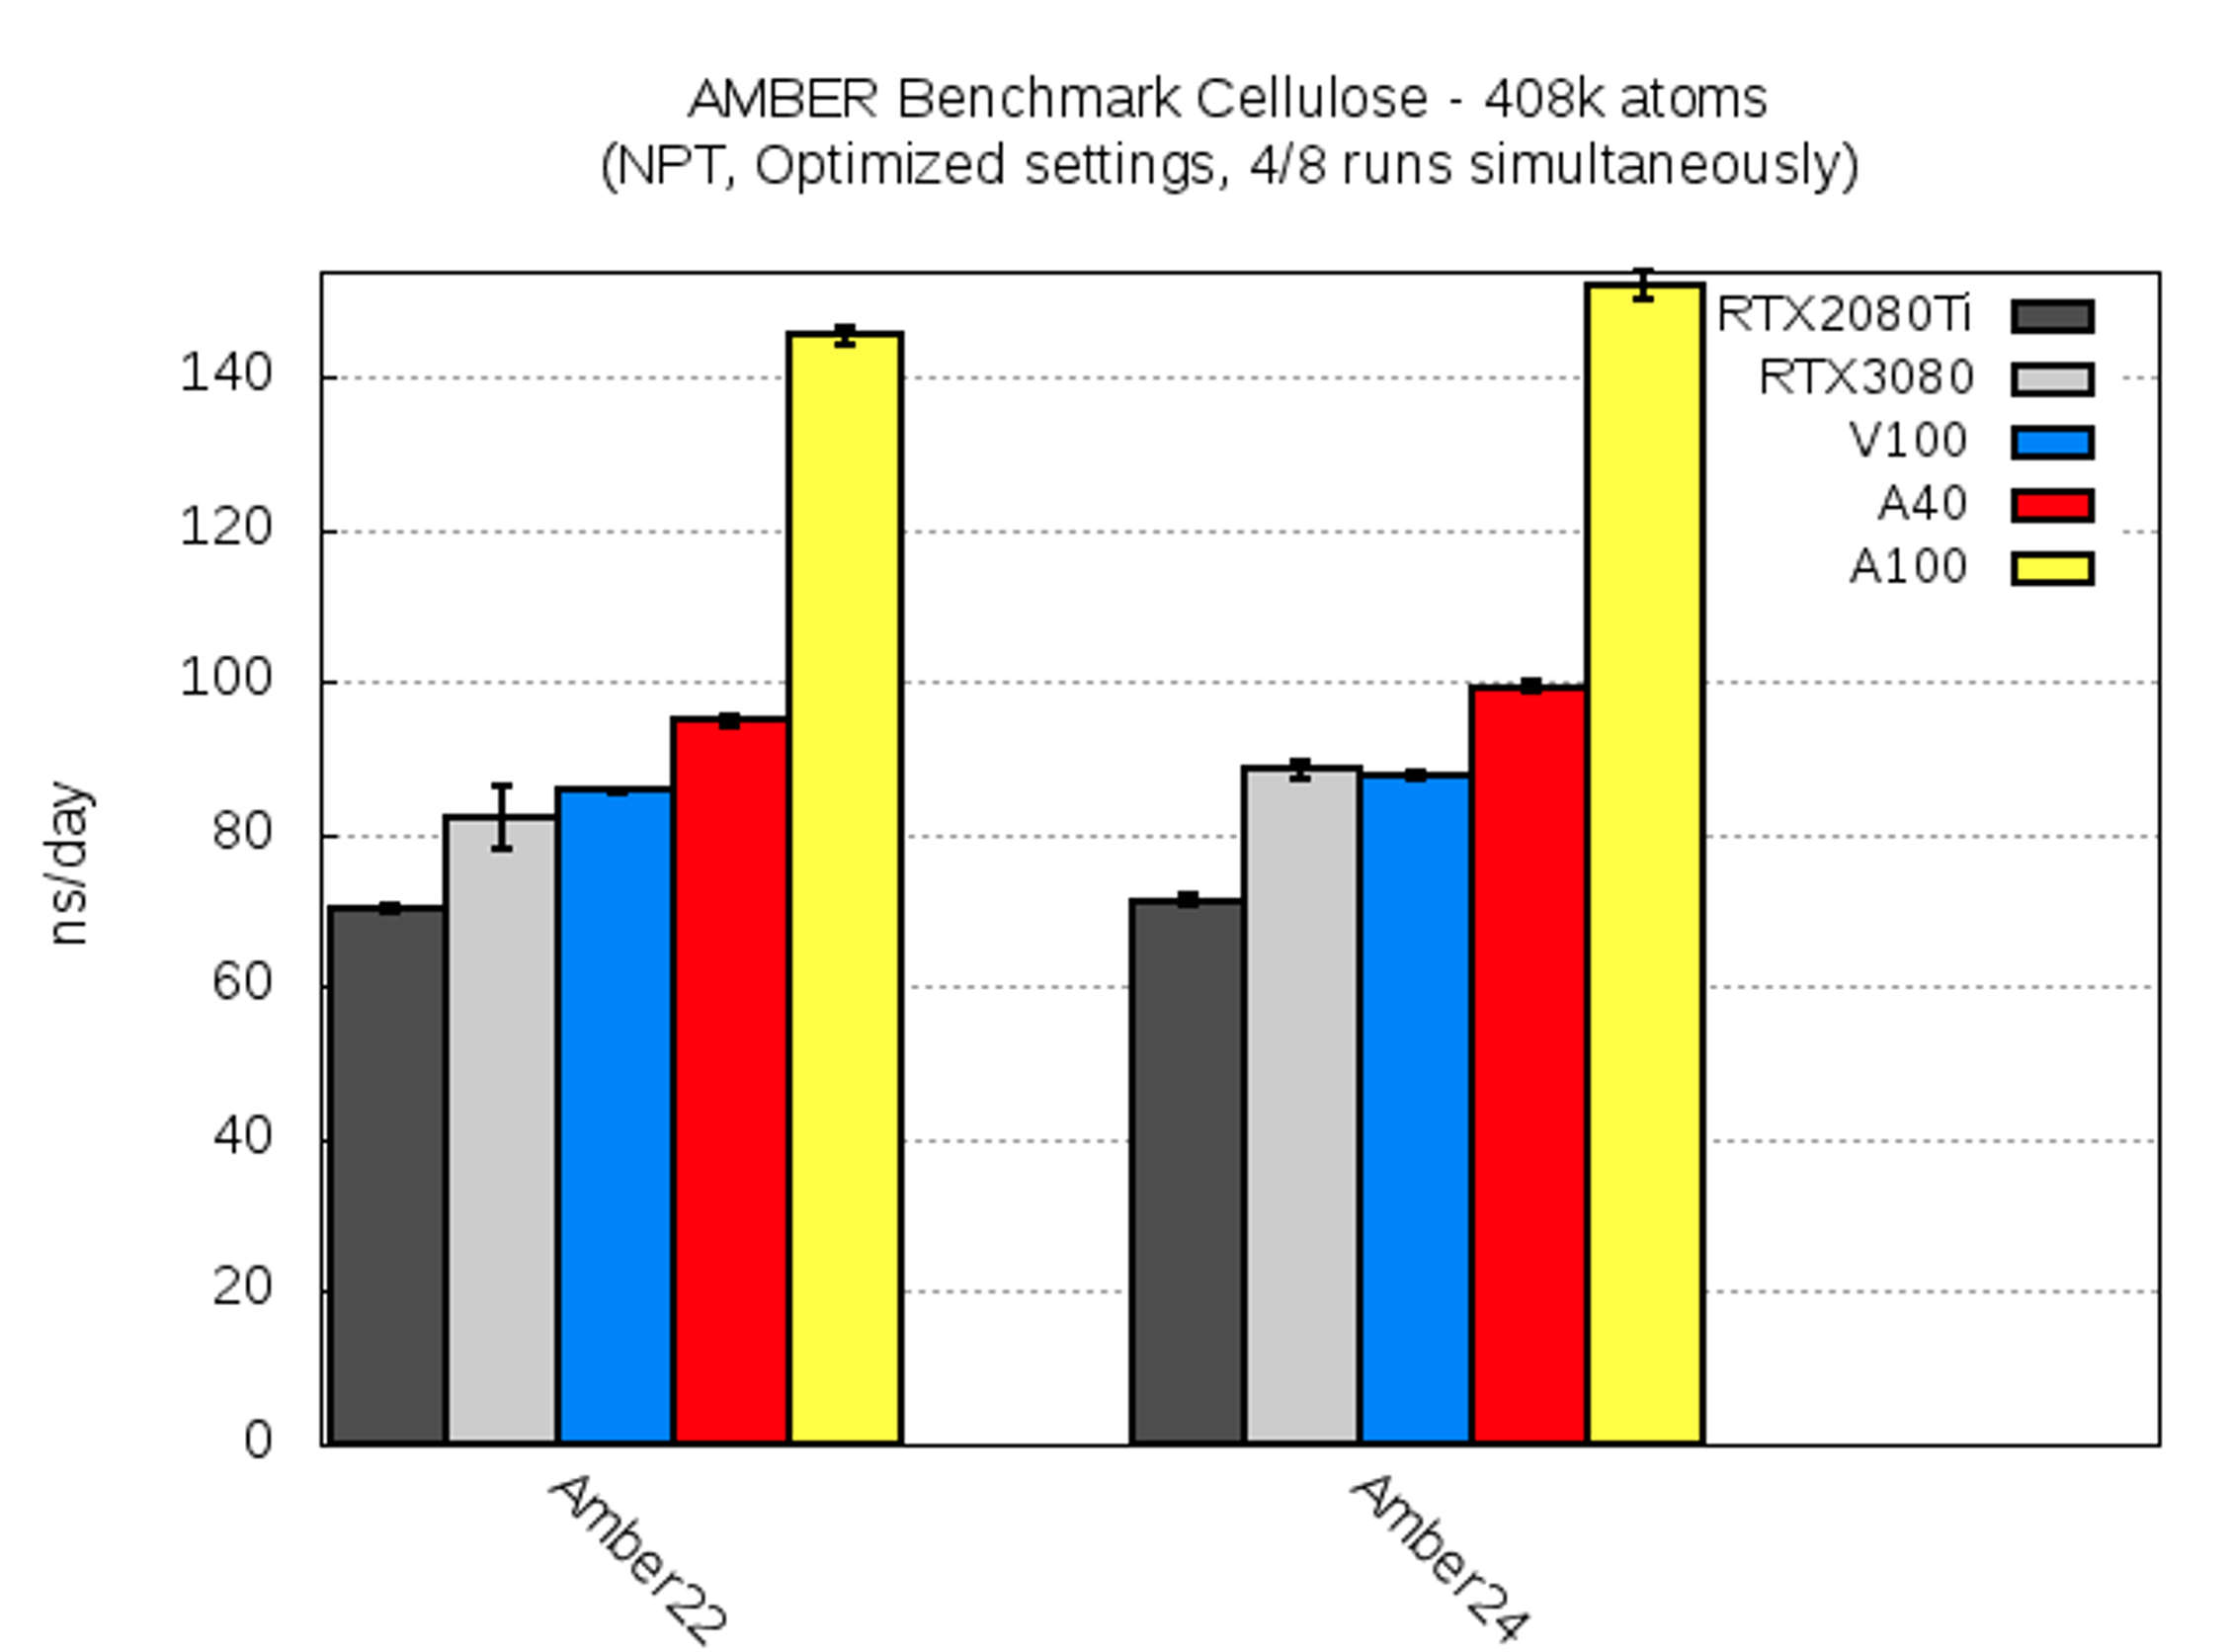
Despite its large size this benchmark system yielded very similar timings within one run (cf. low standard deviations). Thus, the calculation time on different GPUs on the same node was nearly identical. Moreover, the two AMBER versions yielded a very similar performance, too. The speedup from A40 to A100 was roughly a factor of 1.5, and thus much more pronounced than for the smaller systems.
| STMV [ns/day] | RTX2080Ti | RTX3080 | V100 | A40 | A100 |
| AMBER22 | 23.9 ± 0.2 | 28.0 ± 2.8 | 29.7 ± 0.2 | 34.4 ± 0.2 | 52.3 ± 1.4 |
| AMBER24 | 24.1 ± 0.2 | 31.4 ± 0.6 | 30.3 ± 0.2 | 35.8 ± 0.2 | 54.2 ± 1.0 |
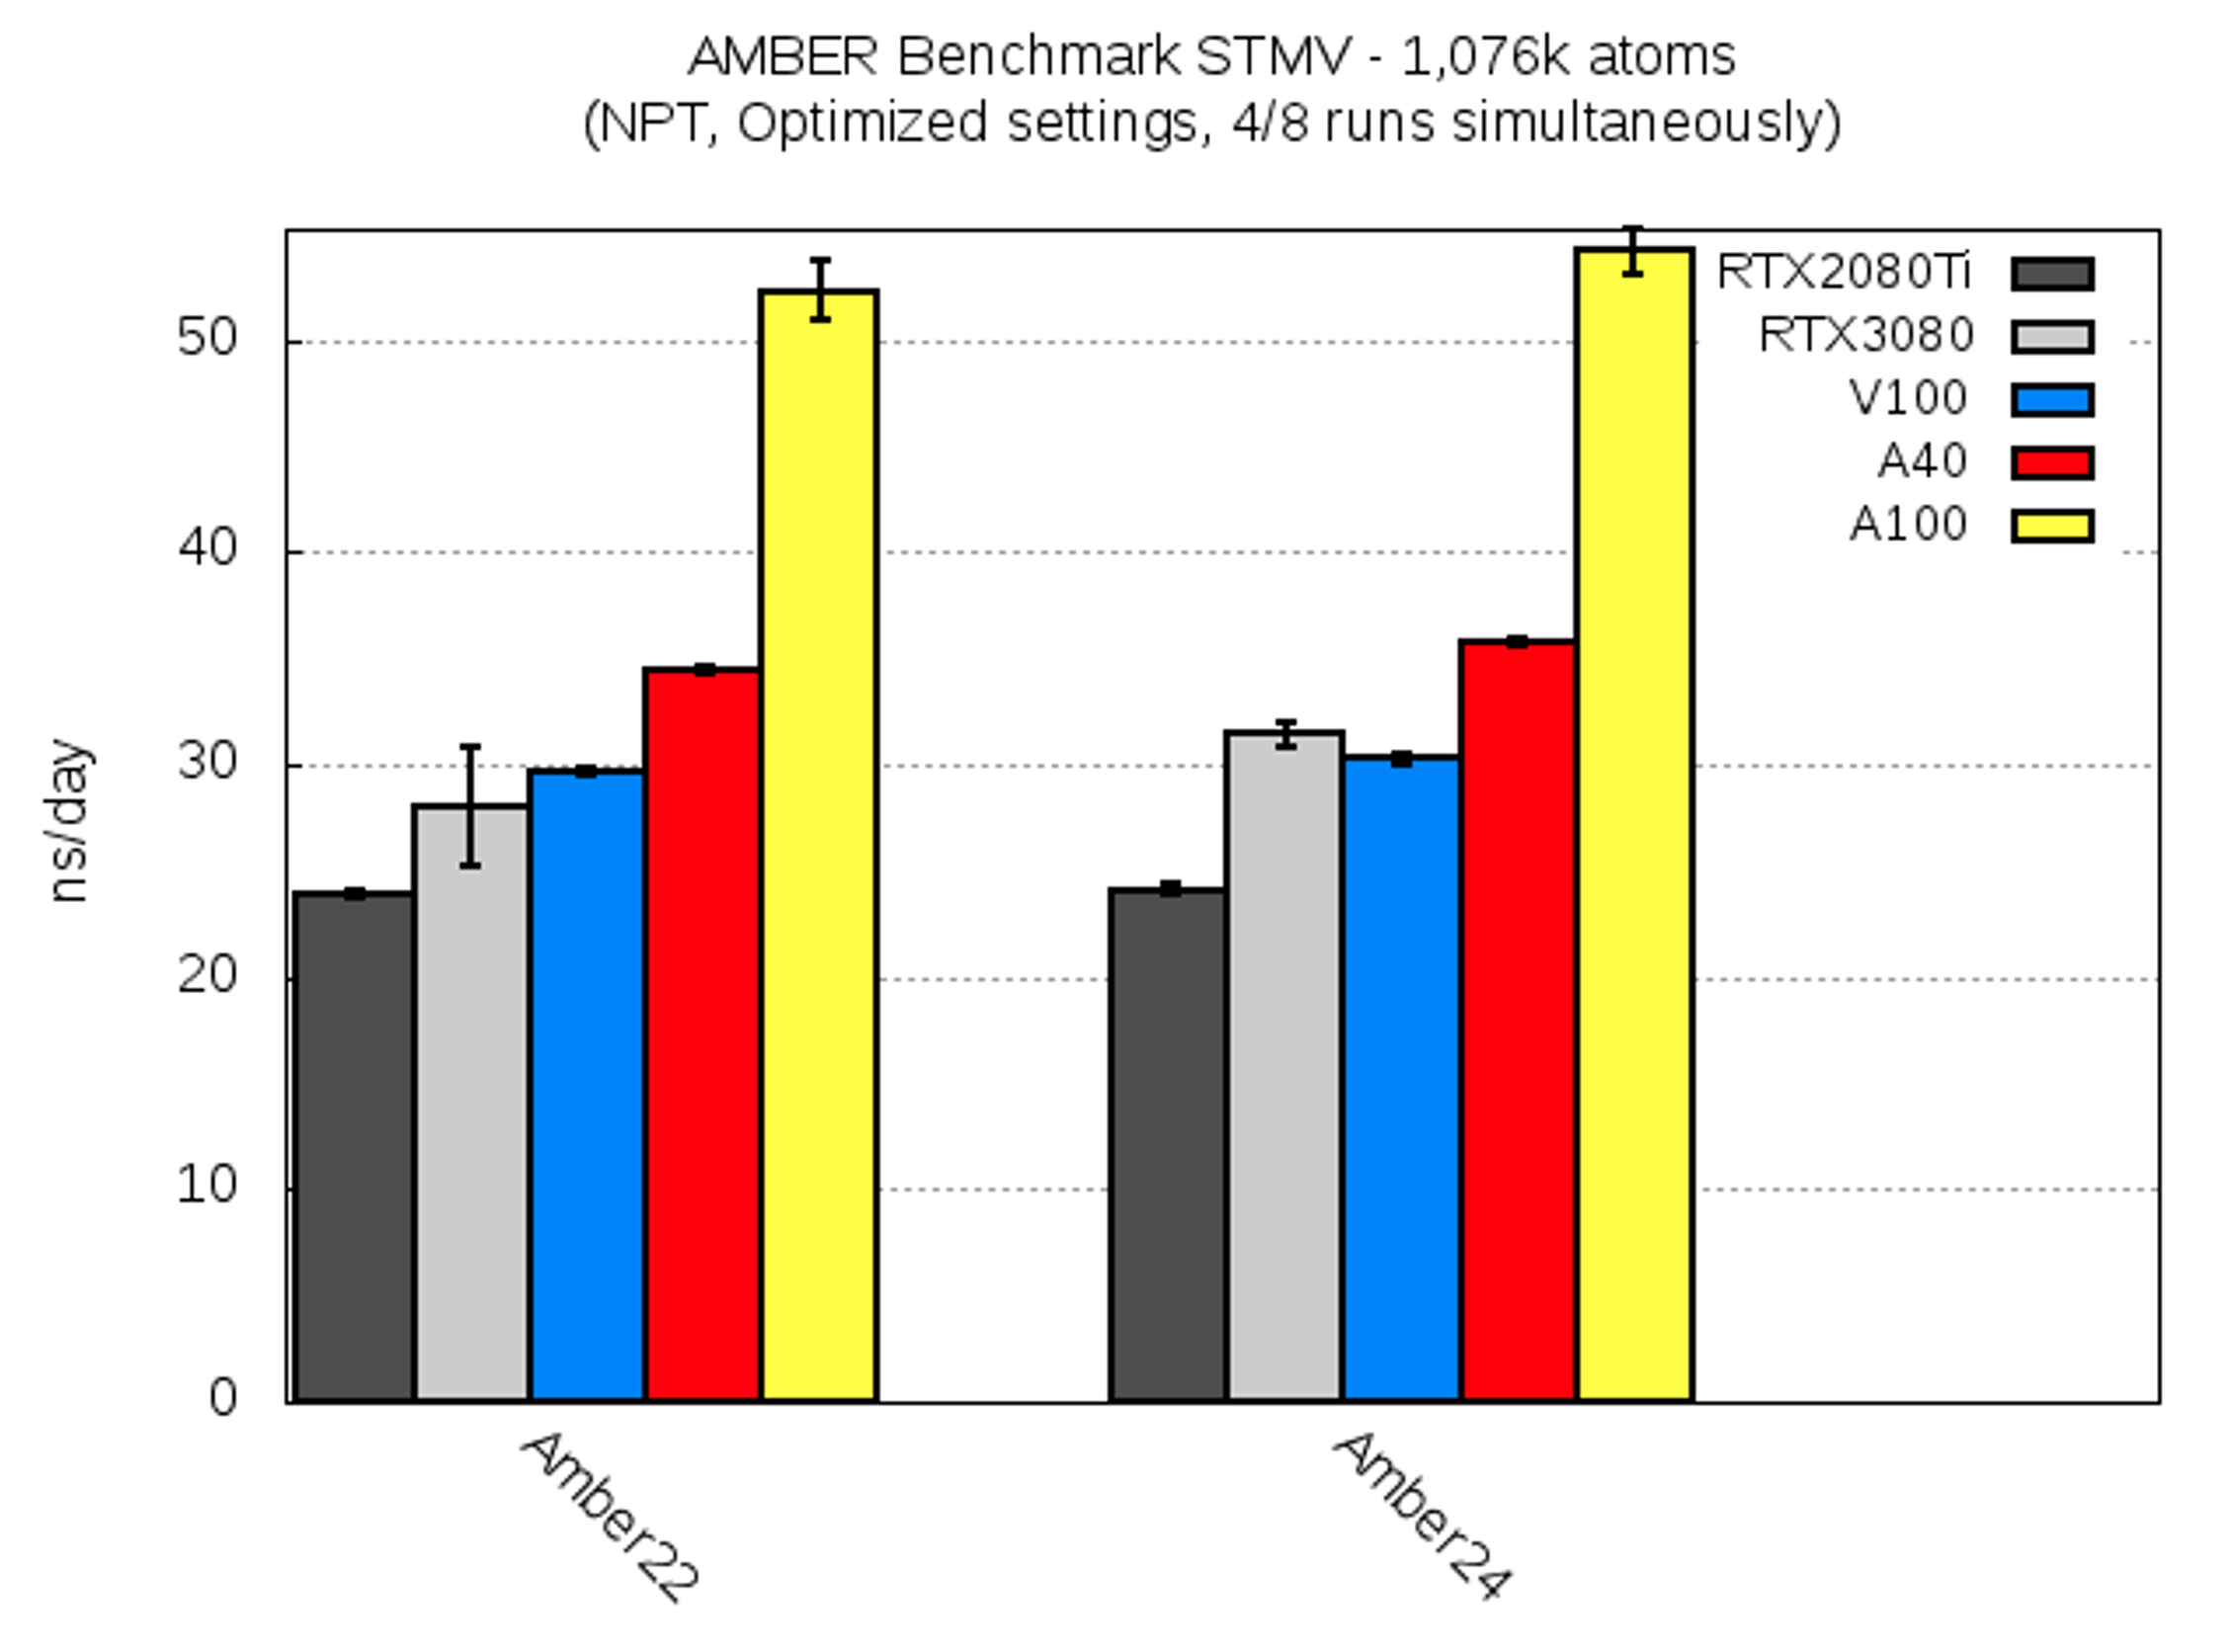
For the last benchmark system, STMV, the trend of the previous systems continued: AMBER24 gave a slightly better performance, and the variation between the different GPUs on a single node was small, unless the cluster network experienced an enhanced load (cf RTX3080 for AMBER22); the speedup from A40 to A100 remained at ca. 1.5 for this huge system.
Conclusions
This study investigated the GPU-performance of the standard AMBER benchmarks on the NHR@FAU cluster “Alex” and the Tier3 cluster “TinyGPU”. Only single-GPU molecular dynamics runs were performed with the CUDA-version of the AMBER module pmemd, since parallelization over multiple GPUs did not yield a reasonable performance speedup in earlier test calculations.
For all five GPU types, AMBER24 yielded a similar or better performance than its predecessor AMBER22. Therefore users may savely choose the newer program version from a performance point of view.
For smaller systems, the consumer GPUs on “TinyGPU” (RTX2080Ti, RTX3080, and V100) showed a very similar performance as the GPUs on “Alex”, i.e. A40 and A100. For these two, the speedup between the A40 and A100 increased with the system size. However, the performance ratio A100/A40 reached only 1.5 for the largest benchmark system, while the procurement cost ratio of these two GPUs was ca. 1.7. Thus, the A40 is the recommended workhorse GPU for AMBER on Alex, unless special requirements justify the use of an A100, as these cards are mainly intended for other applications with larger memory needs.
Additionally, it should be kept in mind when submitting jobs to the clusters that the load of the cluster/network might affect the run time. Thus, it is strongly recommended to add a sufficient amount of buffer time to the run time requested from the queueing system, i.e. at least ca. 10%.
Note that these benchmark calculations only provide a rough estimate for the computational requirements for systems of the reported size. Especially for the preparation of an NHR proposal, NHR@FAU always recommends you to run test calculations for your actual systems and with the special program options intended to obtain more accurate predictions.
30th April 2025
Dr. Anselm Horn
NHR@FAU | Bioinformatik