When autodetection goes wrong
Background
The ab initio quantum chemistry program package ORCA is used for the numerical calculation of molecular frequencies of an organic molecule with 38 atoms using a double-hybrid functional with a triple-zeta basis set. Initial performance of one of these calculations took 76.4 hours to finish on one “Kaby Lake” node of our high-throughput cluster Woody.
Analysis
Multiple parameters like the number of cores and the amount of memory per core were tested on a variety of CPU architectures: Intel Xeon E5-2680 “Broadwell”, Intel Xeon Platinum 8470 “Sapphire Rapid”, Intel Xeon E3-1240 “Kaby Lake”, Intel Xeon Gold 6326 “Ice Lake”, AMD EPYC 7502 “Rome”, and Dual AMD EPYC 9654 “Genoa”.
| CPU type | # of cores used |
Memory per core [GB] | wall time | file size [GB] |
| “Sapphire Rapid” | 26 | 6 | 10:54:46 | >>280 GB |
| “Sapphire Rapid” | 26 | 20 | 10:48:08 | >>280 GB |
| “Sapphire Rapid” | 26 | 30 | 10:49:04 | >>280 GB |
| “Sapphire Rapid” | 52 | 6 | 06:41:08 | >>500 GB |
| “Sapphire Rapid” | 104 | 6 | 05:10:58 | >1.2 TB |
| “Kaby Lake” | 4 | 6 | 76:28:50 | |
| “Ice Lake” | 4 | 48 | 103:34:15 | |
| “Ice Lake” | 32 | 6 | 18:12:26 | |
| “Broadwell” | 28 | 14 | 18:10:35 | |
| “Rome” | 32 | 6 | 09:14:05 | |
| “Rome” | 32 | 12 | 09:22:01 | |
| “Genoa” | 96 | 6 | 03:21:32 | >1.0 TB |
| “Genoa” | 144 | 6 | 04:47:38 |
In general, there seemed to be a big influence of the micro architecture on the runtime and there were three observations that stood out regarding the size of files, the amount of memory per core and the number of cores. First, the space needed to save the temporary files scaled with the number of cores, e.g. on “Sapphire Rapid”: >>280 GB with 26 cores vs. >>500 GB with 52 cores vs. >1.2 TB with 104 cores. Second, there was no benefit in using more than four GB of memory per core, e.g. wall times on “Sapphire Rapid” using 26 cores: the calculations with 20 and 30 GB memory per core took 10:48:08 and 10:49:04, respectively, and the one with six GB memory per code ran for 10:54:46 and on “Rome” using 32 cores: the calculations with six and 12 GB took 9:14:05 and 9:22:01, respectively. And third, the performance increased with the number of cores, e.g. wall times on “Sapphire Rapid”: 10:54:46 on 26 cores, 06:41:08 on 52 cores, and 05:10:58 on 104 cores. Interestingly, the latter observation does not hold true for the “Genoa” system: here, 96 cores ran faster than 144 cores with wall times of 3:21:32 and 4:47:38, respectively.
However, there were also rather strange observations such as:
- The runtime on 32 cores “Rome” (09:14:05) was half of that on 32 cores “Ice Lake” (18:12:26).
- Four cores on “Kaby Lake” (wall time 76:28:50) yielded higher performance than four cores on “Ice Lake” (wall time 103:34:15).
- The performance on “Ice Lake” (wall time 18:12:26) is similar to that on “Broadwell” (wall time 18:10:35).
Support
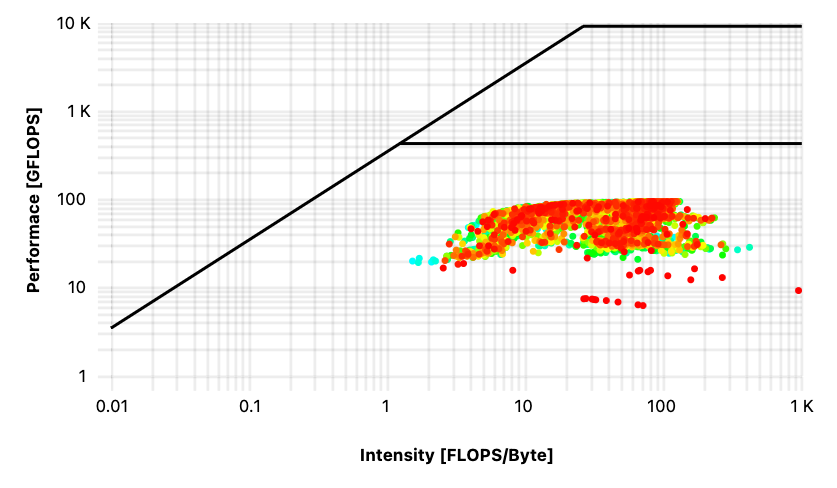
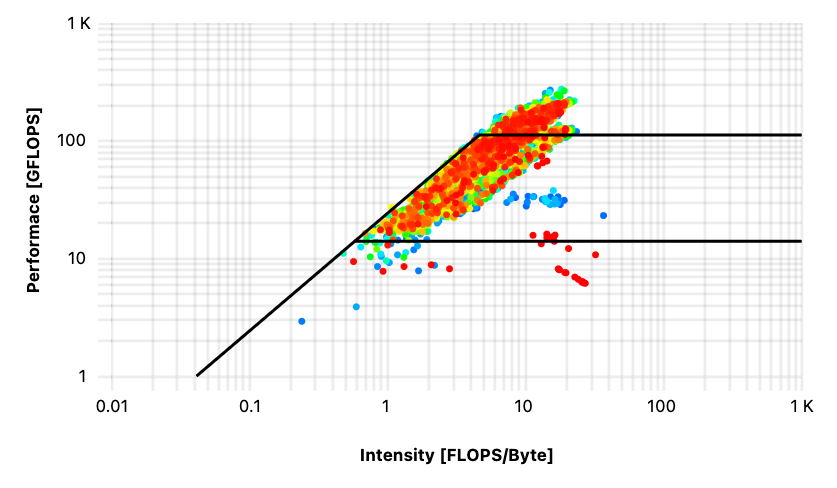
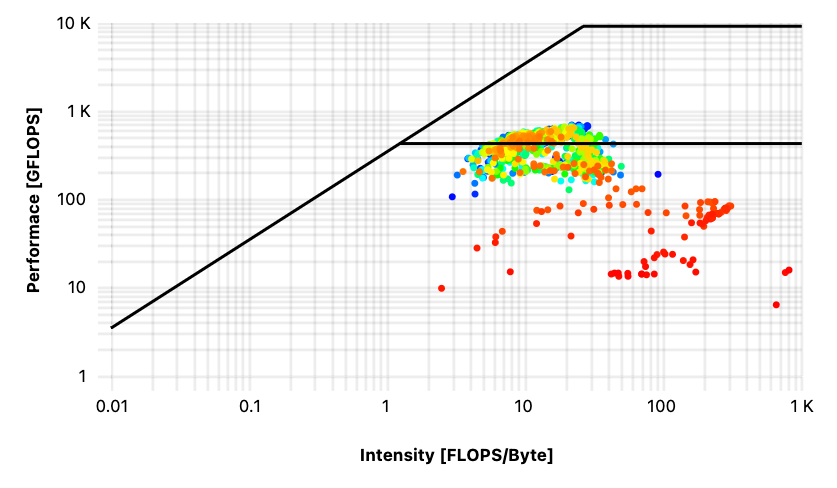
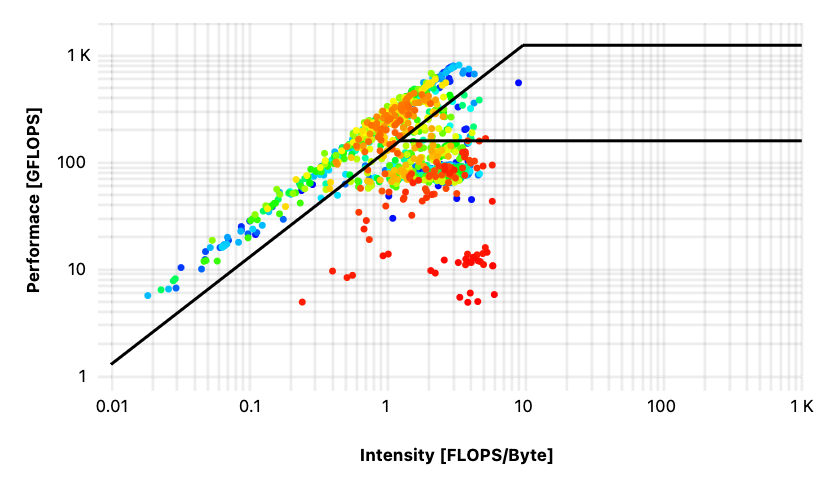
A closer look into the job-specific monitoring of these “strange jobs” revealed striking differences between the corresponding roofline diagrams that can hint to a more fundamental problem with the job setup. Roofline diagrams are plotted with the Intensity in [FLOPS/Byte] on the x-axis and the Performance in [GFLOPS] on the y-axis; three lines are drawn in as well, because they represent the peak memory bandwidth (diagonal line) measured by running the stream benchmark, the peak performance (upper line) that can be calculated from CPU specifications, and the lower line gives the limit for the scalar performance.
First, let’s look at the performance data of the jobs on “Ice Lake” and “Kaby Lake” both running on four cores. The roofline peaks on the diagrams are different because these are two different processors. It is obvious that the two diagrams in Figures 1 and 2 differ vastly and that ORCA does not run with an optimized configuration on “Ice Lake”. In contrast, the distribution of values in Figure 2 shows that the program runs at the limit of both memory bandwidth and performance of the “Kaby Lake” processor.
Next is the comparison between the job on 32 “Ice Lake” cores and 28 cores on “Broadwell”. Again, these two processors have different peak performances but also, the distribution of values is not the same at all: for the run on 32 “Ice Lake” cores, the values are spread below the scalar limit (Figure 3), whereas for the calculation on 28 cores “Broadwell”, the limit seems to be the memory bandwidth (Figure 4).
Ideally, the roofline diagrams should look as close to the one in Figure 2 as possible, so what is the problem here? Why do the older processors give optimized performance, and the newer ones do not? After further testing and near endless searching through output files, the culprit was finally found: the autodetection feature of OpenBLAS.
| CPU type | “Sapphire Rapid” | “Ice Lake” | “Kaby Lake” | “Broadwell” | “Rome” | “Genoa” |
| detected as | Prescott | Prescott | Haswell | Haswell | Zen | Zen |
| ❌ | ❌ | ✅ | ✅ | ✅ | ✅ | |
| should be | SkylakeX | SkylakeX |
While “Cooper Lake” support was added in version 0.3.11 of OpenBLAS, the “Ice Lake” processor should be correctly autodetected since version 0.3.17. Unfortunately, the currently available ORCA-5.0.4 module at NHR@FAU is still using the 0.3.15 version of OpenBLAS as it is statically linked in the binary. Consequently, modern platforms such as “Ice Lake” and “Sapphire Rapid” could not be detected correctly and an outdated architecture support was employed.
Summary
The observation of strange differences in wall time between “newer” and “older” hardware led to an evaluation of the jobs’ roofline diagrams, unveiling unexpected performance behavior. The OpenBLAS library gets statically linked in ORCA and it falsely detected the underlying hardware. By setting the variable OPENBLAS_CORETYPE to the correct architecture type, it was possible to speed up the simulation to finish in only 11 hours on one of the “Ice Lake” nodes in Woody.


