Penguins in the Supercomputer: Interview with biophysicist Alexander Winterl
Thank you very much for being here, Mr. Winterl. You recently published an article about counting penguins in Antarctica. Let’s start in very general terms: Penguins evoke an enthusiastic “aww” from young and old alike, but what is it about them that gets scientists so interested?
We look at the penguins to learn about the ecosystem, because these animals are top predators. Imagine there are thousands of animals in a colony, which then swim several hundred kilometers out into the sea and through large parts of the southern ocean. They collect food there and, in a way, survey the sea for us. When the animals then return to the colony and we study the behavior of the penguins, we can learn something not only about the animals themselves, but also about this entire large area of the ocean that they have swum through.
So the size of a population or the settlement area of a colony is also an indicator of the food that is available, for example?
Exactly. There are relatively few limits to the size of a colony, except for the amount of food that is available.
Are there also long-term observations? It’s not so easy to go to the Antarctic and count penguins. Has data already been collected over decades that can be used to study, for example, global warming based on the populations in the penguin colonies, or is the data situation too limited for this?
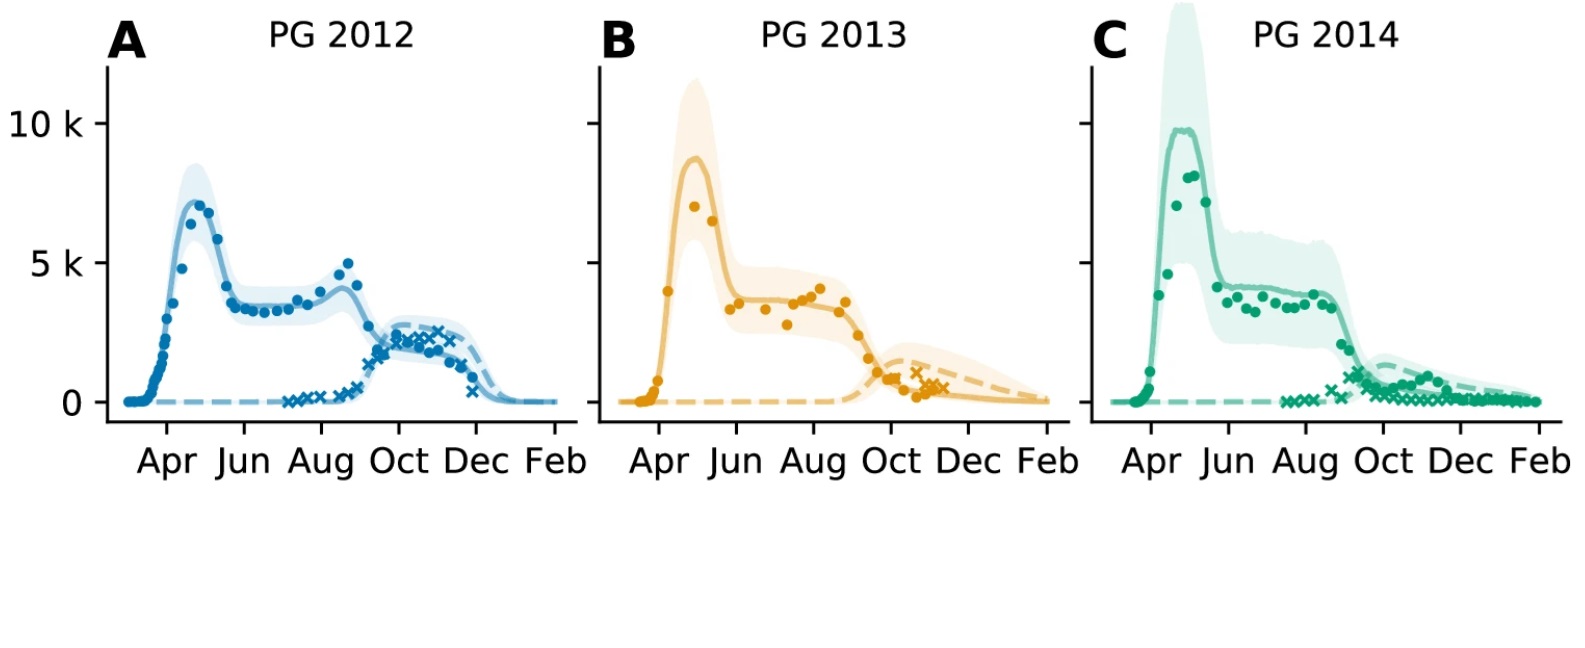
Well, this is actually a much-debated topic. To get reliable data you typically have to measure for three generations, and with penguins it’s around 15–20 years per generation. That means we would have to count, count, and count for at least 45 years to say anything about the long-term trend of their population. Moreover, we have no regular records for such a long period so far. We have been measuring at one colony since 2011, where the animals are actually counted weekly. Another colony has been observed since 2012/2013. All other colonies are only visited sporadically or only recorded by satellite, if at all.
Penguins live to be 15-20 years old?
It is assumed that individual animals can live up to 30 years.
So what exactly do you want to find out about the colonies? Of course, the number of individuals is an important factor, and how it changes over time. But is a colony stationary at all?
For the most part, a colony remains in the area, covering several square kilometers. There are currently 66 colonies that we know of. Of course, individual colonies can sometimes dissolve, or a new one can arise.
How big would you estimate such a colony to be?
The largest colony we know has around 50,000 animals. But there are also small ones with only a few hundred animals. There is a discussion about a lower limit, because the animals huddle together to protect each other from the weather. And this warming function naturally decreases with smaller numbers of animals.
And how important is the structure? That is, males, females, chicks?
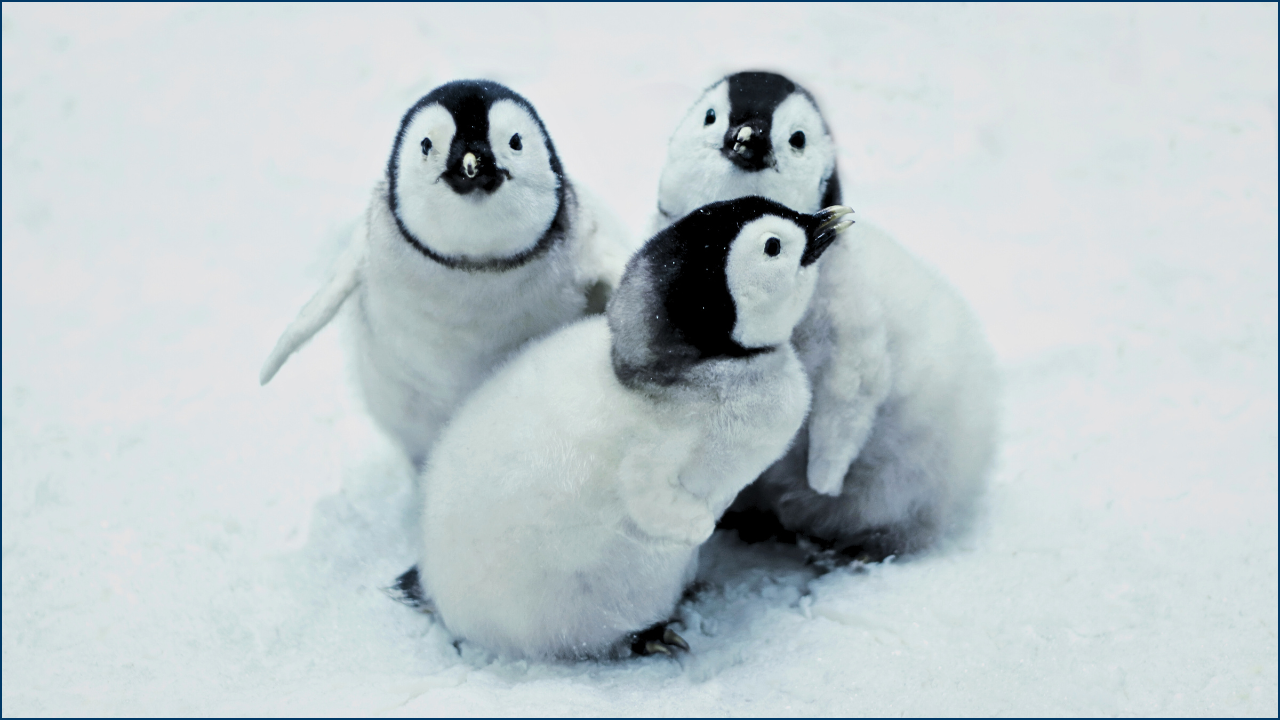
It is not possible to visually distinguish the males from the females; you would have to do blood tests. Males and females could be distinguished by their call, males tend to have a deeper voice, but this is unreliable in practice. Chicks with their gray down feathers could be visually distinguished, however usually not from satellite images. Their number is of great interest to us, but not all of them survive. In principle, every couple breeds one egg a year. The hatching success rate is well over 90 percent. And then it depends on how much food the adults can provide for the chicks and how the weather plays along. Unfortunately, the sea ice is becoming more and more unstable.
Let’s go back to the subject of counting the animals. What exactly is the technical problem? Why not just take satellite pictures and have an AI count the animals?
First, satellite images are only available from October to March due to the polar night. This covers only one third of the breeding cycle. The pictures are already quite good, but the resolution is not yet high enough to count individual animals. All you get is the area of the colony. Also there are strong fluctuations because the parents go out looking for food. Also, not all chicks always survive. Even if I take a satellite picture now in October and can count every single penguin, I don’t actually know how many chicks will still be left in January.
That means you need to have some kind of model for the density of penguins in a certain space that incorporates both, observables and behavior. And that’s basically what your paper is about, isn’t it?
Correct. We have developed a model for how close the animals huddle together. This is driven by their instinct to protect and warm each other. The weather plays a major role in this, in other words temperature, solar radiation, humidity, and wind. And because we can’t identify individual animals from satellite pictures, we first need data with real individual animals that we have counted in order to benchmark this. The second factor is the behavior of the animals over a longer period of time – for example, when the parents go hunting or when the chicks are born – in other words, the timeline that is rooted in the penguins’ behavior.

Is there a complete picture of the Antarctic regarding the weather?
Of course we can’t have a weather station at every colony, but we have good model data between different stations through interpolation.
And the observational data that is needed to validate, or in other words to test the model, comes from these two colonies that are constantly being observed?
Exactly!
Is this also possible during the polar night, or will there be problems?
No, we can maintain this process all year round. Compared to the satellites, of course, the people on the ground have the opportunity to get closer to the colonies and use other cameras. In fact, we can produce consistently good images even on the darkest day of the year. At least in the area where we are, at 66° and 70° south latitude, the sun doesn’t rise above the horizon at midday, but we do have a bit of twilight that can be used. Thermal imaging cameras would also work, but the resolution is comparatively low.
OK, so you have the weather observations. Then the model from your paper should first predict the density of the colony in animals per square meter. How does that work exactly?
The formulas we use are not that complicated. We call it the “windchill model”:
T_a=T+c_WW+c_RR+c_HH \rho=\frac{N}{A}=\frac{12.8}{1+\exp\left((T_a-T_c)/b_0\right)}The first is a linear model for T_a, the “perceived temperature.” It involves the actual temperature T plus three terms in which wind speed W, humidity R and solar radiation H are included. And these prefactors c_W, c_R, and c_H are the parameters we are looking for. The prediction of the perceived temperature is then used in the second formula, which predicts the density of the penguin population in the colony: number of individuals N divided by area A. On the right-hand side we have a so-called sigmoid function, something like a “gentle step.” There are two more parameters in there: T_c is sort of a “limit temperature” at which the animals start to huddle together. And b_0 says something about how quickly this happens as the temperature falls. The number 12.8 is simply the maximum density when all the animals huddle in a minimum area, kind of like a “densest packing of disks.”
So if I want to predict the number of animals in a colony, I need the area, which is available from satellite images, and these five parameters. And these can be derived from direct observations?
That’s right. What you do on the computer is actually the reverse: You randomly select millions of different parameter combinations and check for each of them how well they match the observed data. If a combination fits well, then you accept it and move on from that point. If the combination fits worse than the one before, it is only accepted with a certain probability. The whole process is called the “Markov Chain Monte Carlo” method.
Is it possible to fit the parameters one after the other?
No, because the parameters influence each other, so you can’t define the first one and then move on to the next. You really have to see it as a whole.
So that’s the connection between the weather and the “penguin density.” But there are other factors, especially regarding the number of animals over a period of time. The adults first arrive in April and then mate?
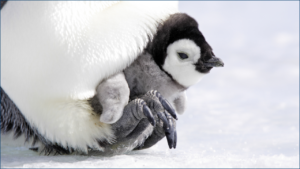 Exactly, and then the females lay their eggs. After that, they are quite exhausted and leave the colony to feed. The male then incubates the egg over the following 60–70 days, roughly between June and September. It will lose up to a third of its body weight before the female returns, well-fed, and takes over the chick. From then on, the parents share the hunting. This whole dynamic is of course reflected in the number of animals in the colony.
But that’s certainly not the same in every year, right?
Yes, of course it also depends on the weather and other conditions: How much food is available, and where is it in the ocean? How big is the amount of ice the parent animals have to cross? This is also the point where we have invested the most energy in the model, so we understand how to model these “back and forth”-processes best and find out how many chicks are still left.
So what exactly is the modeling process for this progression?
We break down the development of the population into different phases, for example, when the future parents arrive, how long it takes to find a mate, how successful the incubation is or how long the parents are away for hunting. In total, there are another 14 parameters, and we call this the “phenological model.” Once the five parameters of the windchill model have been fitted, we look at the phenological model and use the parameters to determine, for example, how many chicks a colony has effectively produced.
So that’s a total of 19 parameters for the entire model. Wouldn’t it be worth considering the use of artificial intelligence (AI) to do all this in one step? The AI then wouldn’t be limited by “prejudices”?
You could probably do that, but you have to keep in mind that this would be a “black box model.” AI might even be able to predict the development of a population more accurately and faster than our model, but the advantage of our method is that we can discern different effects: We learn that colonies start the breeding cycle at varying times, yet the mating period has the same duration and the breeding time of the eggs is also identical. These are things that we don’t know beforehand. In an AI model, such details would be hidden somewhere in the weights of the neural network. So in this case, the “prejudices” are actually advantages.
And what is the next step? Are these results now valid and groundbreaking enough to say that we have solved the problem?
(laughing) Not at all. There’s still a lot of satellite data that we haven’t considered, as well as historical population counts. There may be other data sources as well. A complete model would actually be like an Antarctic-wide observatory for ecological parameters, with penguin populations as an indicator. That is the dream.
Finally, a few technical questions: You used the Woody cluster at the NHR center here at FAU for your calculations, right?
Yes, that cluster is ideal for such high-throughput tasks. You can allocate individual cores and the CPUs have a high clock speed. We could pack Markov Chains as described earlier with different starting points in the parameter space into different batch jobs. This way, the batch scheduler basically did the parallelization for us.
What language is your code actually written in?
It’s Python, but I use various modules and a library that generates C code from the Python model. Each job then runs on the cluster in an Apptainer container.
How was the communication with the NHR center during the project?
The support from your side was fantastic. Whenever I had a problem, I got answers immediately. Especially at the beginning I did a few stupid mistakes that created a lot of load on the file system. I then received an e-mail asking me to change the workflow.
That’s a very common problem if one must access many files again and again. We always recommend copying the files to the local SSD of the compute node and then using them from there.
I did that too, and from then on everything was fine.
That’s how it should be! Mr. Winterl, thank you for the interesting interview!
Original article:
[1] Winterl, A., Richter, S., Houstin, A. et al. Remote sensing of emperor penguin abundance and breeding success. Nat Commun 15, 4419 (2024). DOI: 10.1038/s41467-024-48239-8